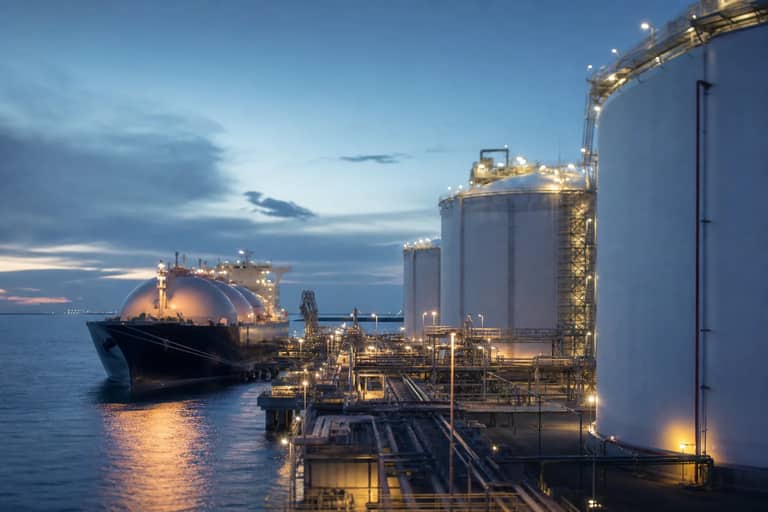
U.S. liquefied natural gas exports averaged 17.4 billion cubic feet per day in the first half of 2026. That is 23% above the same stretch in 2025. The lift was not a one-month price spike. It was new liquefaction trains finally shipping cargoes.
That matters for investors watching Gulf Coast midstream, liquefaction owners, and U.S. gas producers. Capacity additions are the multi-quarter story. Spot prices set the utilization ceiling. The trains set the volume floor.
- EIA (Sept. 1, 2026): U.S. LNG exports averaged 17.4 Bcf/d in 1H26, up 23% from 1H25 — the fastest capacity-driven ramp since large-scale exports began in 2016.
- The same EIA note forecasts 17.3 Bcf/d in 2H26 and 18.7 Bcf/d in 1H27 as remaining trains ramp.
- DOE (June 30, 2026): cumulative long-term non-FTA authorizations reached 55.9 Bcf/d; more than 20 Bcf/d of U.S. export capacity was already operating, with over 38 Bcf/d in operation or under construction.
Trains, not tape prints
Plaquemines LNG is exporting at full capacity. Corpus Christi Stage 3 is shipping from six of seven liquefaction trains. EIA says those two projects alone add a combined 4.0 Bcf/d of nominal capacity when complete. Golden Pass began exports in April 2026; Train 1 is still ramping toward about 0.7 Bcf/d of nominal capacity, and Train 2 is expected late 2026.
Earlier in the year, EIA put peak U.S. export capacity near 18.3 Bcf/d and pointed to the next wave: Port Arthur Phase 1 (1.6 Bcf/d), Rio Grande Trains 1 and 2 (1.4 Bcf/d), and Golden Pass’s final train (0.7 Bcf/d) expected to begin exports in 2027. That is a multiyear build, not a single-quarter surprise.
Global prices stayed high enough in 1H26 to keep U.S. terminals near maximum output. Europe’s TTF averaged $14.74/MMBtu in 1H26, up from $13.10 in 1H25. The Japan-Korea Marker reached a four-year high of $15.56/MMBtu. Strait of Hormuz disruptions cut off roughly 20% of global LNG supply — mostly Qatari — and pushed Asian buyers into the spot market. U.S. shipments to Asia more than doubled, rising 2.3 Bcf/d (108%) from 1H25. Europe was roughly flat on a volume basis (+1%). Latin America, the Caribbean, and MENA rose 0.8 Bcf/d (46%).
What the capacity curve implies
Authorization is not the same as cash flow. DOE’s June snapshot shows tens of Bcf/d still authorized but not yet operating. Final investment decisions, construction schedules, and train startups decide which owners convert paper capacity into cargoes.
Pipeline gas to Mexico is a parallel channel. EIA expects U.S. pipeline exports near 9.8 Bcf/d in 2026 and 10.0 Bcf/d in 2027 as Mexican power demand and Mexico-sited LNG projects take more U.S.-origin gas. That supports Permian and Gulf midstream gatherers even when Atlantic Basin LNG spreads compress.
The investor risk is timing mismatch. Trains that slip a quarter cut near-term volumes. Trains that arrive into softer Asian or European prices compress netbacks. Neither risk cancels the structural fact: U.S. liquefaction nameplate is still rising into 2027.
What to watch
Watch three multi-quarter markers. First, whether Golden Pass Train 2 and Corpus Christi’s seventh Stage 3 train hit late-2026 schedules. Second, whether Port Arthur and Rio Grande start 2027 exports on the EIA timeline. Third, whether Asia-bound volumes stay elevated after Hormuz disruption effects fade, or rotate back toward Europe.
For a 50-plus investor, the portfolio question is simple. Who owns the trains and feedgas that convert this capacity wave into contracted cash flows, and who is exposed if utilization dips when global prices ease? Capacity is catching the export curve. It is not a free option on every LNG headline.